Intel Iris Pro 5200 Grafik im Test: Intels schnellste gegen Nvidia und AMD
 5/8
Wolfgang Andermahr
147 Kommentare

GPU-Computing

Moderne Grafikkarten und damit auch die APUs können deutlich mehr Berechnungen ausführen als nur für eine 3D-Grafik. Mittlerweile gibt es schon zahlreiche Programme, die den 3D-Beschleuniger für andere Aufgaben nutzen und damit der CPU in diesen Gebieten Konkurrenz machen. Doch wie gut können Grafikkarten diese Aufgaben in der Praxis erledigen? Das finden wir anhand einiger theoretischen und praxisnahen Tests heraus. Als Programmierschnittstellen kommen dabei Direct Compute und OpenCL zum Einsatz.

CLBenchmark
  • Physics:
    • Intel Core i7-4750HQ + Iris Pro @ GPU (Schenker)
      3.277
    • Intel Core i7-4700HQ @ GT 750M (Asus)
      2.378
    • AMD A10-6800K @ GPU
      2.154
    • AMD A10-6700 @ GPU
      2.123
    • AMD A10-5800K @ GPU
      1.986
    • Intel Core i7-4770K @ CPU
      1.928
    • Intel Core i7-4770K @ GPU
      1.854
    • Intel Core i7-4700HQ @ GPU (Asus)
      1.809
    • Intel Core i7-3770K + GT 630
      1.716
    • Intel Core i7-3770K @ CPU
      1.699
    • Intel Core i7-3770K @ GPU
      1.578
    • Intel Core i7-4700HQ @ CPU (Asus)
      1.514
    • Intel Core i7-4750HQ + Iris Pro @ CPU (Schenker)
      1.442
    • AMD A10-6800K + HD 6670
      1.382
    • AMD A10-6800K @ CPU
      783
    • AMD A10-6700 @ CPU
      754
    • AMD A10-5800K @ CPU
      729
  • Graphics:
    • Intel Core i7-4750HQ + Iris Pro @ GPU (Schenker)
      56.516
    • Intel Core i7-4770K @ GPU
      41.671
    • Intel Core i7-4700HQ @ GPU (Asus)
      40.803
    • Intel Core i7-4700HQ @ GT 750M (Asus)
      35.608
    • Intel Core i7-3770K @ GPU
      29.338
    • AMD A10-6800K @ GPU
      23.332
    • AMD A10-6700 @ GPU
      22.971
    • Intel Core i7-3770K + GT 630
      22.965
    • Intel Core i7-4770K @ CPU
      22.499
    • Intel Core i7-3770K @ CPU
      22.106
    • AMD A10-5800K @ GPU
      21.478
    • Intel Core i7-4750HQ + Iris Pro @ CPU (Schenker)
      19.151
    • Intel Core i7-4700HQ @ CPU (Asus)
      18.532
    • AMD A10-6800K + HD 6670
      16.525
    • AMD A10-6800K @ CPU
      7.620
    • AMD A10-6700 @ CPU
      7.057
    • AMD A10-5800K @ CPU
      6.915
  • Vision:
    • Intel Core i7-4750HQ + Iris Pro @ GPU (Schenker)
      2.236
    • Intel Core i7-4700HQ @ GT 750M (Asus)
      2.052
    • AMD A10-6800K + HD 6670
      1.711
    • Intel Core i7-3770K @ CPU
      1.691
    • Intel Core i7-4770K @ CPU
      1.656
    • AMD A10-6800K @ GPU
      1.595
    • AMD A10-6700 @ GPU
      1.455
    • Intel Core i7-4750HQ + Iris Pro @ CPU (Schenker)
      1.416
    • Intel Core i7-4770K @ GPU
      1.387
    • Intel Core i7-4700HQ @ GPU (Asus)
      1.330
    • AMD A10-5800K @ GPU
      1.275
    • Intel Core i7-4700HQ @ CPU (Asus)
      1.269
    • Intel Core i7-3770K + GT 630
      1.116
    • Intel Core i7-3770K @ GPU
      951
    • AMD A10-6800K @ CPU
      528
    • AMD A10-6700 @ CPU
      493
    • AMD A10-5800K @ CPU
      489
  • Image Filters:
    • AMD A10-6800K @ GPU
      173.121
    • AMD A10-6700 @ GPU
      169.967
    • AMD A10-5800K @ GPU
      152.783
    • AMD A10-6800K + HD 6670
      142.732
    • Intel Core i7-4700HQ @ GT 750M (Asus)
      140.312
    • Intel Core i7-4750HQ + Iris Pro @ GPU (Schenker)
      105.901
    • Intel Core i7-3770K + GT 630
      104.858
    • Intel Core i7-4770K @ GPU
      84.569
    • Intel Core i7-4700HQ @ GPU (Asus)
      83.571
    • Intel Core i7-3770K @ GPU
      76.282
    • Intel Core i7-4770K @ CPU
      53.364
    • Intel Core i7-3770K @ CPU
      49.041
    • Intel Core i7-4700HQ @ CPU (Asus)
      42.890
    • Intel Core i7-4750HQ + Iris Pro @ CPU (Schenker)
      40.598
    • AMD A10-6800K @ CPU
      14.911
    • AMD A10-6700 @ CPU
      14.112
    • AMD A10-5800K @ CPU
      13.668
  • Programming Principles:
    • Intel Core i7-4750HQ + Iris Pro @ GPU (Schenker)
      28.102
    • Intel Core i7-4770K @ CPU
      25.722
    • Intel Core i7-4750HQ + Iris Pro @ CPU (Schenker)
      25.373
    • Intel Core i7-3770K @ CPU
      23.756
    • Intel Core i7-4700HQ @ GT 750M (Asus)
      21.579
    • Intel Core i7-4770K @ GPU
      21.496
    • Intel Core i7-4700HQ @ GPU (Asus)
      20.864
    • AMD A10-6800K @ GPU
      20.209
    • AMD A10-6700 @ GPU
      20.027
    • Intel Core i7-4700HQ @ CPU (Asus)
      19.543
    • AMD A10-5800K @ GPU
      18.599
    • AMD A10-6800K + HD 6670
      17.338
    • Intel Core i7-3770K + GT 630
      15.944
    • Intel Core i7-3770K @ GPU
      14.980
    • AMD A10-6800K @ CPU
      8.391
    • AMD A10-6700 @ CPU
      7.924
    • AMD A10-5800K @ CPU
      7.073
Einheit: Punkte
ComputeMark
  • Fluid3D:
    • AMD A10-6800K + HD 6670
      170
    • Intel Core i7 4700HQ + GeForce GT 750M (Asus)
      162
    • AMD A10-6800K (HD 8670D)
      156
    • AMD A10-6700 (HD 8670D)
      148
    • AMD A10-5800K (HD 7660D)
      148
    • Intel Core i7 4750HQ (Iris Pro 5200, Schenker)
      122
    • Intel Core i7-3770K + GT 630
      87
    • Intel Core i7-4770K (HD 4600)
      83
    • Intel Core i7 4700HQ (HD 4600, Asus)
      80
    • Intel Core i7-3770K (HD 4000)
      65
  • Fluid2D:
    • Intel Core i7 4700HQ + GeForce GT 750M (Asus)
      151
    • AMD A10-6800K (HD 8670D)
      99
    • AMD A10-6700 (HD 8670D)
      87
    • AMD A10-6800K + HD 6670
      84
    • AMD A10-5800K (HD 7660D)
      84
    • Intel Core i7-3770K + GT 630
      84
    • Intel Core i7-4770K (HD 4600)
      84
    • Intel Core i7 4750HQ (Iris Pro 5200, Schenker)
      84
    • Intel Core i7 4700HQ (HD 4600, Asus)
      79
    • Intel Core i7-3770K (HD 4000)
      44
  • Mandel Vector:
    • Intel Core i7 4700HQ + GeForce GT 750M (Asus)
      298
    • Intel Core i7 4750HQ (Iris Pro 5200, Schenker)
      257
    • AMD A10-6800K (HD 8670D)
      254
    • AMD A10-6700 (HD 8670D)
      254
    • AMD A10-5800K (HD 7660D)
      239
    • Intel Core i7-3770K + GT 630
      224
    • AMD A10-6800K + HD 6670
      214
    • Intel Core i7-4770K (HD 4600)
      156
    • Intel Core i7 4700HQ (HD 4600, Asus)
      150
    • Intel Core i7-3770K (HD 4000)
      128
  • Mandel Scalar:
    • Intel Core i7 4700HQ + GeForce GT 750M (Asus)
      507
    • Intel Core i7-3770K + GT 630
      359
    • Intel Core i7 4750HQ (Iris Pro 5200, Schenker)
      343
    • AMD A10-6800K (HD 8670D)
      181
    • AMD A10-6700 (HD 8670D)
      181
    • AMD A10-5800K (HD 7660D)
      171
    • Intel Core i7-4770K (HD 4600)
      155
    • Intel Core i7 4700HQ (HD 4600, Asus)
      146
    • AMD A10-6800K + HD 6670
      144
    • Intel Core i7-3770K (HD 4000)
      102
  • QJulia:
    • Intel Core i7 4700HQ + GeForce GT 750M (Asus)
      533
    • Intel Core i7 4750HQ (Iris Pro 5200, Schenker)
      490
    • Intel Core i7-3770K + GT 630
      434
    • Intel Core i7-4770K (HD 4600)
      288
    • Intel Core i7 4700HQ (HD 4600, Asus)
      269
    • AMD A10-6800K (HD 8670D)
      258
    • AMD A10-6700 (HD 8670D)
      254
    • AMD A10-5800K (HD 7660D)
      254
    • AMD A10-6800K + HD 6670
      228
    • Intel Core i7-3770K (HD 4000)
      222
Einheit: Punkte
Folding@Home
  • Explicit:
    • Intel Core i7-4700HQ @ GT 750M (Asus)
      5,0
    • Intel Core i7-4750HQ + Iris Pro @ GPU (Schenker)
      4,8
    • Intel Core i7-4770K @ GPU
      4,2
    • Intel Core i7-4700HQ @ GPU (Asus)
      4,1
    • Intel Core i7-4770K @ CPU
      3,9
    • Intel Core i7-3770K + GT 630
      3,6
    • Intel Core i7-3770K @ GPU
      3,4
    • Intel Core i7-3770K @ CPU
      3,4
    • AMD A10-6800K @ GPU
      3,3
    • AMD A10-6700 @ GPU
      3,2
    • Intel Core i7-4700HQ @ CPU (Asus)
      3,2
    • Intel Core i7-4750HQ + Iris Pro @ CPU (Schenker)
      3,1
    • AMD A10-5800K @ GPU
      3,0
    • AMD A10-6800K + HD 6670
      2,5
    • AMD A10-6800K @ CPU
      1,0
    • AMD A10-6700 @ CPU
      0,9
    • AMD A10-5800K @ CPU
      0,9
  • Implicit:
    • Intel Core i7-4750HQ + Iris Pro @ GPU (Schenker)
      32,5
    • Intel Core i7-4700HQ @ GT 750M (Asus)
      26,1
    • AMD A10-6800K @ GPU
      23,1
    • AMD A10-6700 @ GPU
      22,9
    • Intel Core i7-4770K @ GPU
      22,8
    • Intel Core i7-4700HQ @ GPU (Asus)
      22,4
    • AMD A10-5800K @ GPU
      21,7
    • Intel Core i7-3770K + GT 630
      20,1
    • AMD A10-6800K + HD 6670
      18,7
    • Intel Core i7-3770K @ GPU
      18,7
    • Intel Core i7-4770K @ CPU
      4,6
    • Intel Core i7-4700HQ @ CPU (Asus)
      3,7
    • Intel Core i7-4750HQ + Iris Pro @ CPU (Schenker)
      3,5
    • Intel Core i7-3770K @ CPU
      3,4
    • AMD A10-6800K @ CPU
      1,7
    • AMD A10-6700 @ CPU
      1,6
    • AMD A10-5800K @ CPU
      1,6
Einheit: Punkte
Luxmark
  • Simple:
    • Intel Core i7-4770K @ CPU
      4.373
    • AMD A10-6800K + HD 6670
      4.213
    • Intel Core i7-3770K @ CPU
      4.106
    • Intel Core i7-4750HQ + Iris Pro @ CPU (Schenker)
      3.607
    • Intel Core i7-4700HQ @ CPU (Asus)
      3.590
    • Intel Core i7-4750HQ + Iris Pro @ GPU (Schenker)
      3.561
    • Intel Core i7-4700HQ @ GT 750M (Asus)
      3.061
    • Intel Core i7-4770K @ GPU
      2.354
    • AMD A10-6800K @ GPU
      2.280
    • Intel Core i7-4700HQ @ GPU (Asus)
      2.208
    • AMD A10-6700 @ GPU
      2.199
    • AMD A10-5800K @ GPU
      2.092
    • Intel Core i7-3770K @ GPU
      1.989
    • AMD A10-6800K @ CPU
      1.757
    • AMD A10-6700 @ CPU
      1.649
    • AMD A10-5800K @ CPU
      1.619
    • Intel Core i7-3770K + GT 630
      591
  • Medium:
    • Intel Core i7-4770K @ CPU
      590
    • Intel Core i7-3770K @ CPU
      552
    • Intel Core i7-4700HQ @ CPU (Asus)
      491
    • AMD A10-6800K + HD 6670
      450
    • Intel Core i7-4750HQ + Iris Pro @ CPU (Schenker)
      442
    • Intel Core i7-4750HQ + Iris Pro @ GPU (Schenker)
      441
    • Intel Core i7-4700HQ @ GT 750M (Asus)
      390
    • Intel Core i7-4770K @ GPU
      282
    • Intel Core i7-4700HQ @ GPU (Asus)
      261
    • Intel Core i7-3770K @ GPU
      257
    • AMD A10-6800K @ CPU
      245
    • AMD A10-6800K @ GPU
      242
    • AMD A10-6700 @ GPU
      237
    • AMD A10-6700 @ CPU
      228
    • AMD A10-5800K @ CPU
      224
    • AMD A10-5800K @ GPU
      219
    • Intel Core i7-3770K + GT 630
      90
  • Complex:
    • Intel Core i7-3770K @ CPU
      343
    • Intel Core i7-4770K @ CPU
      343
    • Intel Core i7-4750HQ + Iris Pro @ CPU (Schenker)
      323
    • Intel Core i7-4750HQ + Iris Pro @ GPU (Schenker)
      308
    • Intel Core i7-4700HQ @ CPU (Asus)
      290
    • AMD A10-6800K + HD 6670
      214
    • Intel Core i7-4700HQ @ GT 750M (Asus)
      212
    • Intel Core i7-4770K @ GPU
      176
    • Intel Core i7-3770K @ GPU
      167
    • Intel Core i7-4700HQ @ GPU (Asus)
      167
    • AMD A10-6800K @ CPU
      143
    • AMD A10-6700 @ CPU
      133
    • AMD A10-5800K @ CPU
      129
    • AMD A10-6800K @ GPU
      117
    • AMD A10-6700 @ GPU
      115
    • AMD A10-5800K @ GPU
      108
    • Intel Core i7-3770K + GT 630
      43
Einheit: Punkte
Rightware BaseMark CL
  • Gesamtergebnis:
    • Intel Core i7 4750HQ (Iris Pro 5200, Schenker)
      81,2
    • AMD A10-6800K + HD 6670
      62,5
    • AMD A10-6800K (HD 8670D)
      57,9
    • Intel Core i7-4770K (HD 4600)
      55,2
    • AMD A10-6700 (HD 8670D)
      55,1
    • AMD A10-5800K (HD 7660D)
      53,0
    • Intel Core i7 4700HQ (HD 4600, Asus)
      49,9
    • Intel Core i7-3770K (HD 4000)
      40,1
    • Intel Core i7-3770K + GT 630
      0,0
      Absturz
    • Intel Core i7 4700HQ + GeForce GT 750M (Asus)
      0,0
      Absturz
  • Physics:
    • Intel Core i7 4750HQ (Iris Pro 5200, Schenker)
      50,6
    • Intel Core i7-4770K (HD 4600)
      38,5
    • AMD A10-6800K + HD 6670
      38,1
    • Intel Core i7 4700HQ (HD 4600, Asus)
      34,7
    • AMD A10-6800K (HD 8670D)
      26,8
    • Intel Core i7-3770K (HD 4000)
      26,1
    • AMD A10-6700 (HD 8670D)
      24,5
    • AMD A10-5800K (HD 7660D)
      24,2
    • Intel Core i7-3770K + GT 630
      0,0
      Absturz
    • Intel Core i7 4700HQ + GeForce GT 750M (Asus)
      0,0
      Absturz
  • General:
    • Intel Core i7 4750HQ (Iris Pro 5200, Schenker)
      421,3
    • Intel Core i7-4770K (HD 4600)
      312,2
    • Intel Core i7 4700HQ (HD 4600, Asus)
      292,4
    • Intel Core i7-3770K (HD 4000)
      228,7
    • AMD A10-6800K (HD 8670D)
      156,8
    • AMD A10-6700 (HD 8670D)
      156,1
    • AMD A10-5800K (HD 7660D)
      144,1
    • AMD A10-6800K + HD 6670
      117,2
    • Intel Core i7-3770K + GT 630
      0,0
      Absturz
    • Intel Core i7 4700HQ + GeForce GT 750M (Asus)
      0,0
      Absturz
  • Image:
    • AMD A10-6800K (HD 8670D)
      54,5
    • AMD A10-6700 (HD 8670D)
      53,9
    • AMD A10-5800K (HD 7660D)
      51,0
    • AMD A10-6800K + HD 6670
      45,1
    • Intel Core i7 4750HQ (Iris Pro 5200, Schenker)
      41,6
    • Intel Core i7-4770K (HD 4600)
      23,0
    • Intel Core i7 4700HQ (HD 4600, Asus)
      21,3
    • Intel Core i7-3770K (HD 4000)
      18,0
    • Intel Core i7-3770K + GT 630
      0,0
      Absturz
    • Intel Core i7 4700HQ + GeForce GT 750M (Asus)
      0,0
      Absturz
  • Video:
    • AMD A10-6800K (HD 8670D)
      527,7
    • AMD A10-6700 (HD 8670D)
      515,8
    • AMD A10-5800K (HD 7660D)
      484,5
    • AMD A10-6800K + HD 6670
      463,6
    • Intel Core i7 4750HQ (Iris Pro 5200, Schenker)
      397,2
    • Intel Core i7-4770K (HD 4600)
      238,6
    • Intel Core i7 4700HQ (HD 4600, Asus)
      200,3
    • Intel Core i7-3770K (HD 4000)
      194,9
    • Intel Core i7-3770K + GT 630
      0,0
      Absturz
    • Intel Core i7 4700HQ + GeForce GT 750M (Asus)
      0,0
      Absturz
Einheit: Punkte

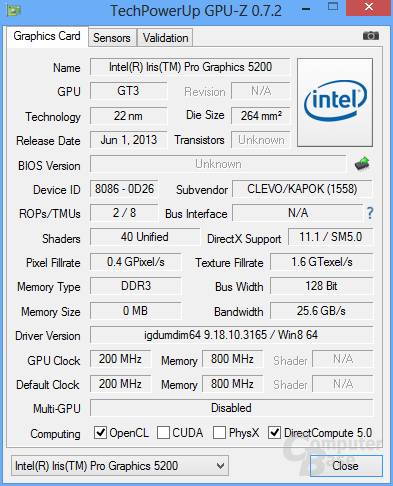
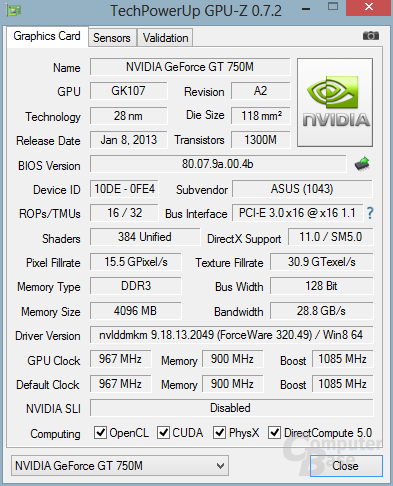
Bereits die Graphics HD 4600 konnte beim GPU-Computing überzeugen und daran ändert sich auch bei der schnelleren Iris Pro Graphics 5200 nichts. Die GPU schafft es spielend, sich nochmals vom kleineren Bruder abzusetzen. In wenigen Fällen ist die GPU gar mehr als doppelt so schnell, meistens liegt die Differenz zwischen 60 und 80 Prozent. Nur in ausgewählten Tests fallen die Unterschiede dagegen geringer aus.

Die Nvidia GeForce GT 750M heftet sich der Intel-GPU zwar meistens an die Versen, muss sich in einigen Szenarien aber auch klar geschlagen geben. In anderen Fällen ist die Kepler-Karte dagegen schneller. Die AMD-APU der Richland-GPU ist meistens weit abgeschlagen. Diese hat mit dem Problem zu kämpfen, dass die derzeit noch eingesetzte VLIW4-Architektur nicht so gut für das GPU-Computing geeignet ist.

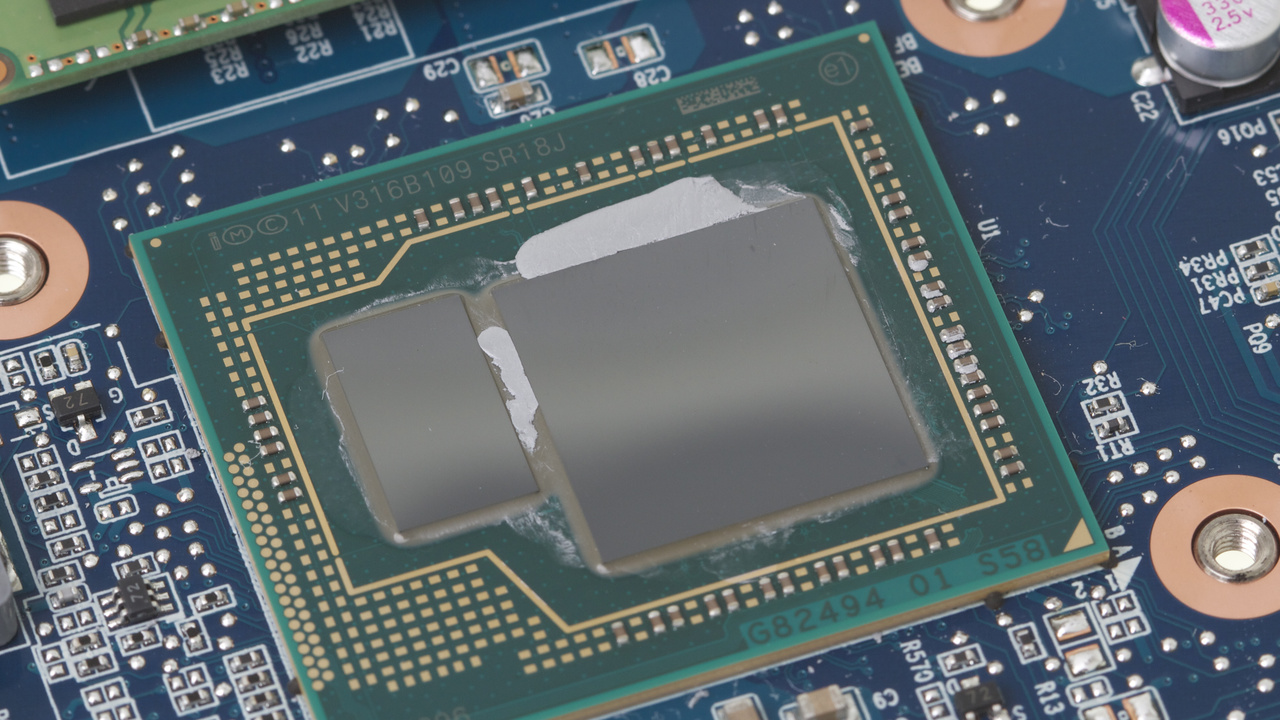
Auf Intels Core i7-4750HQ kann darüber hinaus nicht nur die GPU sondern ebenso die CPU den eingesetzten EDRAM nutzen. Dadurch kann es passieren, dass die CPU trotz geringerer Frequenzen schneller als der Core i7-4700HQ ist. Das lässt sich zum Beispiel im CLBenchmark in einigen Tests erkennen. Den größten Vorteil gibt es im Abschnitt „Programming Principles“. Dort bringt der EDRAM satte 30 Prozent. Das ist aber die Ausnahme, meistens liegt die Differenz, sofern überhaupt vorhanden, bei weniger als fünf Prozent.

Transcodierung und WebGL

Ein spezielles Einsatzgebiet des GPU-Computings ist das Transcodieren von Videos, sei es in andere Auflösungen oder andere Codecs. Um die Geschwindigkeit auf Intels neuer Haswell-Plattform zu testen, wandeln wir einen 1.080p-Trailer (3:30 Minuten) mittels des H.264-Codecs in die Auflösung 1.280x720 um. Als Software nutzen wir dafür Cyberlinks Media Espresso in der Version 6.7.

Video-Transcodierung
  • 1080p-Video nach 720p:
    • Intel Core i7-4750HQ + Iris Pro @ GPU (Schenker)
      2:33
    • Intel Core i7-4770K @ GPU
      3:19
    • Intel Core i7-4700HQ @ GPU (Asus)
      3:21
    • Intel Core i7-3770K @ GPU
      3:29
    • Intel Core i7-4700HQ @ GT 750M (Asus)
      3:31
    • Intel Core i7-3770K + GT 630
      4:32
    • AMD A10-6800K @ GPU
      5:15
    • AMD A10-6800K + HD 6670
      5:32
    • Intel Core i7-4770K @ CPU
      5:49
    • AMD A10-6700 @ GPU
      5:54
    • Intel Core i7-4750HQ + Iris Pro @ CPU (Schenker)
      5:56
    • Intel Core i7-3770K @ CPU
      6:08
    • AMD A10-5800K @ GPU
      6:18
    • Intel Core i7-4700HQ @ CPU (Asus)
      6:49
    • AMD A10-6800K @ CPU
      10:32
    • AMD A10-6700 @ CPU
      11:33
    • AMD A10-5800K @ CPU
      12:16
Einheit: Minuten, Sekunden

Beim Transcodieren eines Videos erzielt die Iris Pro Graphics 5200 das mit Abstand beste Ergebnis: Innerhalb von nur zwei Minuten und 33 Sekunden ist der Prozessor fertig, die Graphics HD 4600 benötigt dazu fast eine Minute länger. Auch die GeForce GTX 750M ist chancenlos und braucht ziemlich genau eine Minute länger.

Darüber hinaus scheint die Videoumwandlung auch den EDRAM nutzen zu können, wenn ausschließlich die CPU zum berechnen verwendet wird. Trotz leicht geringerer Frequenzen ist der Core i7-4750HQ um 15 Prozent schneller als der Core i7-4700HQ. Damit überholt die Notebook-CPU den Desktop-Prozessor Core i7-3770K und muss sich nur knapp dem Core i7-4770K geschlagen geben.

WebGL

Die größte Neuerung im Browser-Segment der letzten Zeit war eine neuartige GPU-Beschleunigung, die mittels der WebGL-API die 3D-Grafik des Browsers unterstützen kann. WebGL wurde primär von der Khronos Group entwickelt, wobei auch AMD und Nvidia mit von der Partie waren. WebGL muss von der Grafikkarte unterstützt werden.

Die WebGL-Performance testen wir anhand der „Fish Bowl“-Demo. Wir nutzen die forderndste Einstellungen, sprich 2.000 dargestellte Fische. Darüber hinaus testen wir die Citadel-Demo von Epic unter HTML5, die eine angepasste Unreal Engine 3 verwendet.

WebGL
  • Epic Citadel:
    • Intel Core i7-4750HQ + Iris Pro @ GPU (Schenker)
      118,0
    • AMD A10-6800K @ GPU
      83,7
    • AMD A10-6700 @ GPU
      78,4
    • Intel Core i7-4700HQ @ GT 750M (Asus)
      76,8
    • Intel Core i7-4770K @ GPU
      74,6
    • Intel Core i7-4700HQ @ GPU (Asus)
      73,2
    • AMD A10-5800K @ GPU
      70,2
    • Intel Core i7-3770K @ GPU
      67,2
    • Intel Core i7-3770K + GT 630
      61,0
    • AMD A10-6800K + HD 6670
      39,8
    • Intel Core i7-3770K @ CPU
      14,0
    • Intel Core i7-4770K @ CPU
      14,0
    • Intel Core i7-4700HQ @ CPU (Asus)
      13,0
    • Intel Core i7-4750HQ + Iris Pro @ CPU (Schenker)
      13,0
    • AMD A10-6800K @ CPU
      11,0
    • AMD A10-6700 @ CPU
      11,0
    • AMD A10-5800K @ CPU
      10,0
Einheit: Bilder pro Sekunde (FPS)

Im WebGL-Test „Citadel“ von Epic konnte sich schon die Graphics HD 4600 vorne platzieren und die Iris Pro Graphics HD 5200 übernimmt spielend die Führung. Die Differenz zur anderen Intel-GPU beträgt 61 Prozent, was in 54 Prozent mehr Leistung gegenüber der GeForce GT 750M resultiert. Die hat in diesem Test allerdings so ihre Schwierigkeiten, auch die AMD-APUs liefern bessere Ergebnisse ab.