Minidump1 : Waren keine Fehler
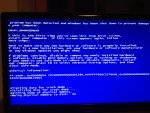
Minidump2: Fehler??... Crash Dump Analysis provided by OSR Open Systems Resources, Inc. (
http://www.osr.com)
Online Crash Dump Analysis Service
See
http://www.osronline.com for more information
Windows 7 Kernel Version 7601 (Service Pack 1) MP (4 procs) Free x64
Product: WinNt, suite: TerminalServer SingleUserTS Personal
Built by: 7601.18113.amd64fre.win7sp1_gdr.130318-1533
Machine Name:
Kernel base = 0xfffff800`03210000 PsLoadedModuleList = 0xfffff800`03453670
Debug session time: Thu Sep 5 11:29:17.730 2013 (UTC - 4:00)
System Uptime: 0 days 7:14:33.088
*******************************************************************************
* *
* Bugcheck Analysis *
* *
*******************************************************************************
SYSTEM_THREAD_EXCEPTION_NOT_HANDLED_M (1000007e)
This is a very common bugcheck. Usually the exception address pinpoints
the driver/function that caused the problem. Always note this address
as well as the link date of the driver/image that contains this address.
Some common problems are exception code 0x80000003. This means a hard
coded breakpoint or assertion was hit, but this system was booted
/NODEBUG. This is not supposed to happen as developers should never have
hardcoded breakpoints in retail code, but ...
If this happens, make sure a debugger gets connected, and the
system is booted /DEBUG. This will let us see why this breakpoint is
happening.
Arguments:
Arg1: ffffffffc0000005, The exception code that was not handled
Arg2: fffff88005020e2f, The address that the exception occurred at
Arg3: fffff880044a6568, Exception Record Address
Arg4: fffff880044a5dc0, Context Record Address
Debugging Details:
------------------
TRIAGER: Could not open triage file : e:\dump_analysis\program\triage\modclass.ini, error 2
EXCEPTION_CODE: (NTSTATUS) 0xc0000005 - The instruction at "0x%08lx" referenced memory at "0x%08lx". The memory could not be "%s".
FAULTING_IP:
dxgmms1!VIDMM_GLOBAL::ReferenceAllocationForPreparation+2b
fffff880`05020e2f 0fba63540d bt dword ptr [rbx+54h],0Dh
EXCEPTION_RECORD: fffff880044a6568 -- (.exr 0xfffff880044a6568)
ExceptionAddress: fffff88005020e2f (dxgmms1!VIDMM_GLOBAL::ReferenceAllocationForPreparation+0x000000000000002b)
ExceptionCode: c0000005 (Access violation)
ExceptionFlags: 00000000
NumberParameters: 2
Parameter[0]: 0000000000000000
Parameter[1]: 0000000000000054
Attempt to read from address 0000000000000054
CONTEXT: fffff880044a5dc0 -- (.cxr 0xfffff880044a5dc0)
rax=fffff8a00fc5add0 rbx=0000000000000000 rcx=fffffa800a0f0000
rdx=fffffa8007a21ba0 rsi=fffffa800a0f0000 rdi=fffffa800a0f0000
rip=fffff88005020e2f rsp=fffff880044a67a0 rbp=fffffa800c332e60
r8=fffffa800aaa0001 r9=0000000000000000 r10=0000000000000000
r11=0000000000000197 r12=fffffa8007a21ba0 r13=0000000000000001
r14=0000000000000000 r15=0000000000000001
iopl=0 nv up ei ng nz na po nc
cs=0010 ss=0018 ds=002b es=002b fs=0053 gs=002b efl=00010286
dxgmms1!VIDMM_GLOBAL::ReferenceAllocationForPreparation+0x2b:
fffff880`05020e2f 0fba63540d bt dword ptr [rbx+54h],0Dh ds:002b:00000000`00000054=????????
Resetting default scope
CUSTOMER_CRASH_COUNT: 1
PROCESS_NAME: System
CURRENT_IRQL: 0
ERROR_CODE: (NTSTATUS) 0xc0000005 - The instruction at "0x%08lx" referenced memory at "0x%08lx". The memory could not be "%s".
EXCEPTION_PARAMETER1: 0000000000000000
EXCEPTION_PARAMETER2: 0000000000000054
READ_ADDRESS: GetPointerFromAddress: unable to read from fffff800034bd100
GetUlongFromAddress: unable to read from fffff800034bd1c0
0000000000000054 Nonpaged pool
FOLLOWUP_IP:
dxgmms1!VIDMM_GLOBAL::ReferenceAllocationForPreparation+2b
fffff880`05020e2f 0fba63540d bt dword ptr [rbx+54h],0Dh
BUGCHECK_STR: 0x7E
DEFAULT_BUCKET_ID: NULL_CLASS_PTR_DEREFERENCE
LAST_CONTROL_TRANSFER: from fffff8800501dff7 to fffff88005020e2f
STACK_TEXT:
fffff880`044a67a0 fffff880`0501dff7 : 00000000`00000000 fffffa80`0bc864c8 00000000`000000fe 00000000`00000000 : dxgmms1!VIDMM_GLOBAL::ReferenceAllocationForPreparation+0x2b
fffff880`044a67d0 fffff880`050387d9 : 00000000`00000000 fffff8a0`09a18aa0 fffffa80`00000000 fffffa80`0aaa0010 : dxgmms1!VIDMM_GLOBAL:

repareDmaBuffer+0x43f
fffff880`044a69a0 fffff880`05038514 : fffff800`00b96080 fffff880`05037f00 fffffa80`00000000 fffffa80`00000000 : dxgmms1!VidSchiSubmitRenderCommand+0x241
fffff880`044a6b90 fffff880`05038012 : 00000000`00000000 fffffa80`07c2ad50 00000000`00000080 fffffa80`09f08010 : dxgmms1!VidSchiSubmitQueueCommand+0x50
fffff880`044a6bc0 fffff800`03523ede : 00000000`01037336 fffffa80`078b3b50 fffffa80`06f889e0 fffffa80`078b3b50 : dxgmms1!VidSchiWorkerThread+0xd6
fffff880`044a6c00 fffff800`03276906 : fffff800`03400e80 fffffa80`078b3b50 fffff800`0340ecc0 65733452`6732426d : nt!PspSystemThreadStartup+0x5a
fffff880`044a6c40 00000000`00000000 : fffff880`044a7000 fffff880`044a1000 fffff880`044a6540 00000000`00000000 : nt!KiStartSystemThread+0x16
SYMBOL_STACK_INDEX: 0
SYMBOL_NAME: dxgmms1!VIDMM_GLOBAL::ReferenceAllocationForPreparation+2b
FOLLOWUP_NAME: MachineOwner
MODULE_NAME: dxgmms1
IMAGE_NAME: dxgmms1.sys
DEBUG_FLR_IMAGE_TIMESTAMP: 5164dc13
STACK_COMMAND: .cxr 0xfffff880044a5dc0 ; kb
FAILURE_BUCKET_ID: X64_0x7E_dxgmms1!VIDMM_GLOBAL::ReferenceAllocationForPreparation+2b
BUCKET_ID: X64_0x7E_dxgmms1!VIDMM_GLOBAL::ReferenceAllocationForPreparation+2b
Followup: MachineOwner
Minidump3: Crash Dump Analysis provided by OSR Open Systems Resources, Inc. (
http://www.osr.com)
Online Crash Dump Analysis Service
See
http://www.osronline.com for more information
Windows 7 Kernel Version 7601 (Service Pack 1) MP (4 procs) Free x64
Product: WinNt, suite: TerminalServer SingleUserTS Personal
Built by: 7601.18113.amd64fre.win7sp1_gdr.130318-1533
Machine Name:
Kernel base = 0xfffff800`03249000 PsLoadedModuleList = 0xfffff800`0348c670
Debug session time: Sat Sep 7 15:52:27.799 2013 (UTC - 4:00)
System Uptime: 0 days 4:04:06.173
*******************************************************************************
* *
* Bugcheck Analysis *
* *
*******************************************************************************
PAGE_FAULT_IN_NONPAGED_AREA (50)
Invalid system memory was referenced. This cannot be protected by try-except,
it must be protected by a Probe. Typically the address is just plain bad or it
is pointing at freed memory.
Arguments:
Arg1: fffff8a20db11ea0, memory referenced.
Arg2: 0000000000000001, value 0 = read operation, 1 = write operation.
Arg3: fffff88005a1b61e, If non-zero, the instruction address which referenced the bad memory
address.
Arg4: 0000000000000005, (reserved)
Debugging Details:
------------------
Could not read faulting driver name
TRIAGER: Could not open triage file : e:\dump_analysis\program\triage\modclass.ini, error 2
WRITE_ADDRESS: GetPointerFromAddress: unable to read from fffff800034f6100
GetUlongFromAddress: unable to read from fffff800034f61c0
fffff8a20db11ea0 Paged pool
FAULTING_IP:
dxgmms1!VIDMM_GLOBAL::CloseOneAllocation+182
fffff880`05a1b61e 48894108 mov qword ptr [rcx+8],rax
MM_INTERNAL_CODE: 5
CUSTOMER_CRASH_COUNT: 1
DEFAULT_BUCKET_ID: WIN7_DRIVER_FAULT
BUGCHECK_STR: 0x50
PROCESS_NAME: GTAIV.exe
CURRENT_IRQL: 0
TRAP_FRAME: fffff8800a04d170 -- (.trap 0xfffff8800a04d170)
NOTE: The trap frame does not contain all registers.
Some register values may be zeroed or incorrect.
rax=fffff8a00db11e98 rbx=0000000000000000 rcx=fffff8a20db11e98
rdx=fffffa800a0db000 rsi=0000000000000000 rdi=0000000000000000
rip=fffff88005a1b61e rsp=fffff8800a04d300 rbp=0000000000000000
r8=fffffa800a0de3f0 r9=0000000000000001 r10=fffffffffffffffe
r11=fffff8800a04d2d0 r12=0000000000000000 r13=0000000000000000
r14=0000000000000000 r15=0000000000000000
iopl=0 nv up ei ng nz na po nc
dxgmms1!VIDMM_GLOBAL::CloseOneAllocation+0x182:
fffff880`05a1b61e 48894108 mov qword ptr [rcx+8],rax ds:fffff8a2`0db11ea0=????????????????
Resetting default scope
LAST_CONTROL_TRANSFER: from fffff8000333b5a3 to fffff800032bec00
STACK_TEXT:
fffff880`0a04d008 fffff800`0333b5a3 : 00000000`00000050 fffff8a2`0db11ea0 00000000`00000001 fffff880`0a04d170 : nt!KeBugCheckEx
fffff880`0a04d010 fffff800`032bcd2e : 00000000`00000001 fffff8a2`0db11ea0 00000000`00000000 fffffa80`0c613720 : nt! ?? ::FNODOBFM::`string'+0x43801
fffff880`0a04d170 fffff880`05a1b61e : fffffa80`0c613720 fffffa80`0c613720 fffff8a0`0dee7e50 00000000`00000000 : nt!KiPageFault+0x16e
fffff880`0a04d300 fffff880`05a01ecc : fffffa80`00000000 fffffa80`00000000 00000000`00000000 00000000`00000000 : dxgmms1!VIDMM_GLOBAL::CloseOneAllocation+0x182
fffff880`0a04d3d0 fffff880`04d36ccc : 00000000`00000000 fffff8a0`0dac7000 fffff8a0`0dac7000 00000000`00000001 : dxgmms1!VidMmCloseAllocation+0x44
fffff880`0a04d400 fffff880`04d497d8 : 00000000`00000001 00000000`00000000 00000000`00000000 fffff8a0`00000799 : dxgkrnl!DXGDEVICE:

estroyAllocations+0x248
fffff880`0a04d4f0 fffff880`04d2e815 : 00000000`fffffeda fffff8a0`08a4fb10 fffff8a0`0dac7000 fffffa80`0a0bd000 : dxgkrnl!DXGDEVICE::~DXGDEVICE+0x19c
fffff880`0a04d560 fffff880`04d6cf0e : 00000000`00000001 fffffa80`0a0bd000 fffff8a0`08a4fb10 fffff8a0`08a4fb90 : dxgkrnl!DXGADAPTER:
estroyDevice+0x1c9
fffff880`0a04d590 fffff880`04d6c8a4 : fffff900`c1f3dce0 00000000`00000000 00000000`00000001 fffff900`c1f3dce0 : dxgkrnl!DXGPROCESS:
estroy+0xba
fffff880`0a04d640 fffff960`00166c34 : 00000000`00000908 fffff900`c1f3dce0 00000000`00000000 fffff900`c1f3dce0 : dxgkrnl!DxgkProcessCallout+0x268
fffff880`0a04d6d0 fffff960`0016632f : 00000000`00000000 fffff880`0a04dae0 fffffa80`0984b060 00000000`00000000 : win32k!GdiProcessCallout+0x244
fffff880`0a04d750 fffff800`03594c21 : 00000000`00000000 00000000`00000000 00000000`00000000 fffffa80`0984b000 : win32k!W32pProcessCallout+0x6b
fffff880`0a04d780 fffff800`0357adbd : 00000000`cfffffff 00002d2d`2969fd01 00000000`78457300 fffffa80`09ca8060 : nt!PspExitThread+0x4d1
fffff880`0a04d880 fffff800`032b171a : fffff800`03439e80 00000000`00000008 fffffa80`746c6644 fffff880`0a04d960 : nt!PsExitSpecialApc+0x1d
fffff880`0a04d8b0 fffff800`032b1a60 : 00000000`00000246 fffff880`0a04d930 fffff800`0357ad30 00000000`00000001 : nt!KiDeliverApc+0x2ca
fffff880`0a04d930 fffff800`032bdf37 : fffff880`0a04db60 fffffa80`09e1c760 fffff880`0a04dab8 fffff800`035b7800 : nt!KiInitiateUserApc+0x70
fffff880`0a04da70 00000000`75462e09 : 00000000`00000000 00000000`00000000 00000000`00000000 00000000`00000000 : nt!KiSystemServiceExit+0x9c
00000000`17b9ee78 00000000`00000000 : 00000000`00000000 00000000`00000000 00000000`00000000 00000000`00000000 : 0x75462e09
STACK_COMMAND: kb
FOLLOWUP_IP:
dxgmms1!VIDMM_GLOBAL::CloseOneAllocation+182
fffff880`05a1b61e 48894108 mov qword ptr [rcx+8],rax
SYMBOL_STACK_INDEX: 3
SYMBOL_NAME: dxgmms1!VIDMM_GLOBAL::CloseOneAllocation+182
FOLLOWUP_NAME: MachineOwner
MODULE_NAME: dxgmms1
IMAGE_NAME: dxgmms1.sys
DEBUG_FLR_IMAGE_TIMESTAMP: 5164dc13
FAILURE_BUCKET_ID: X64_0x50_dxgmms1!VIDMM_GLOBAL::CloseOneAllocation+182
BUCKET_ID: X64_0x50_dxgmms1!VIDMM_GLOBAL::CloseOneAllocation+182
Followup: MachineOwner
---------
Minidump4: Crash Dump Analysis provided by OSR Open Systems Resources, Inc. (
http://www.osr.com)
Online Crash Dump Analysis Service
See
http://www.osronline.com for more information
Windows 7 Kernel Version 7601 (Service Pack 1) MP (4 procs) Free x64
Product: WinNt, suite: TerminalServer SingleUserTS Personal
Built by: 7601.18113.amd64fre.win7sp1_gdr.130318-1533
Machine Name:
Kernel base = 0xfffff800`03200000 PsLoadedModuleList = 0xfffff800`03443670
Debug session time: Sun Sep 8 14:26:47.611 2013 (UTC - 4:00)
System Uptime: 0 days 3:48:27.595
*******************************************************************************
* *
* Bugcheck Analysis *
* *
*******************************************************************************
MEMORY_MANAGEMENT (1a)
# Any other values for parameter 1 must be individually examined.
Arguments:
Arg1: 0000000000041284, A PTE or the working set list is corrupt.
Arg2: fffff900c3276001
Arg3: 0000000000000af5
Arg4: fffff90000812000
Debugging Details:
------------------
TRIAGER: Could not open triage file : e:\dump_analysis\program\triage\modclass.ini, error 2
BUGCHECK_STR: 0x1a_41284
CUSTOMER_CRASH_COUNT: 1
DEFAULT_BUCKET_ID: WIN7_DRIVER_FAULT
PROCESS_NAME: chrome.exe
CURRENT_IRQL: 0
LAST_CONTROL_TRANSFER: from fffff800032cc717 to fffff80003275c00
STACK_TEXT:
fffff880`098c62f8 fffff800`032cc717 : 00000000`0000001a 00000000`00041284 fffff900`c3276001 00000000`00000af5 : nt!KeBugCheckEx
fffff880`098c6300 fffff800`03265c19 : af500001`33abd863 ffffffff`ffffffff 00000000`00000000 00000000`00000000 : nt! ?? ::FNODOBFM::`string'+0x4ad3
fffff880`098c6340 fffff800`032651c1 : fffff900`00000000 00000000`00000004 00000000`00000000 00000000`00000000 : nt!MiDeleteSystemPagableVm+0x179
fffff880`098c64a0 fffff800`033a65b1 : fffff900`c28e2010 fffff960`001a639d 00000000`000005d0 00000000`00003273 : nt!MiFreePagedPoolPages+0x12d
fffff880`098c65f0 fffff800`033a98a7 : 00000000`00000000 fffff880`098c67c0 fffff880`098c6740 fffff880`00000001 : nt!MiFreePoolPages+0x2b1
fffff880`098c6700 fffff960`003368ff : 00000000`00000001 fffffa80`09c8ce50 fffff880`63616347 00000000`00000000 : nt!ExFreePoolWithTag+0x7c7
fffff880`098c67b0 fffff960`001593cb : fffff900`c0130010 fffff900`c3256010 fffff900`c008a010 fffff960`0015cd4c : win32k!RFONTOBJ::vDeleteRFONT+0x32b
fffff880`098c6820 fffff960`00158dff : fffff900`c22a73d0 fffff880`098c68c0 fffff900`c22a73d0 00000000`00000000 : win32k!RFONTOBJ::bMakeInactiveHelper+0x427
fffff880`098c68a0 fffff960`001a80ed : fffff880`098c6a20 fffff880`098c6a20 00000000`00000000 00000000`00000001 : win32k!RFONTOBJ::vMakeInactive+0xa3
fffff880`098c6940 fffff960`001a8354 : fffff880`098c6a20 fffff900`c1c4e100 00000000`00000000 fffff900`c3256010 : win32k!XDCOBJ::bCleanDC+0x36d
fffff880`098c6a00 fffff960`001a133b : fffff900`c1c4e100 fffff900`c0581e90 00000000`74822450 00000000`0009e710 : win32k!GreCleanDC+0x34
fffff880`098c6a40 fffff960`001a1223 : ffffffff`88010c17 fffff880`098c6b60 fffffa80`0a3e0d20 00000000`00000000 : win32k!ReleaseCacheDC+0xfb
fffff880`098c6a80 fffff960`001b5eba : 00000000`0009fd20 00000000`7484addc 00000000`00000006 fffffa80`0a3e0d20 : win32k!ReleaseDC+0xb
fffff880`098c6ab0 fffff800`03274e93 : 00000000`00000002 00000000`0030cf80 00000000`00000020 00000000`0030e694 : win32k!NtUserCallOneParam+0x4e
fffff880`098c6ae0 00000000`7486fdfa : 00000000`00000000 00000000`00000000 00000000`00000000 00000000`00000000 : nt!KiSystemServiceCopyEnd+0x13
00000000`0009dda8 00000000`00000000 : 00000000`00000000 00000000`00000000 00000000`00000000 00000000`00000000 : 0x7486fdfa
STACK_COMMAND: kb
FOLLOWUP_IP:
win32k!RFONTOBJ::vDeleteRFONT+32b
fffff960`003368ff 4c89b730020000 mov qword ptr [rdi+230h],r14
SYMBOL_STACK_INDEX: 6
SYMBOL_NAME: win32k!RFONTOBJ::vDeleteRFONT+32b
FOLLOWUP_NAME: MachineOwner
MODULE_NAME: win32k
IMAGE_NAME: win32k.sys
DEBUG_FLR_IMAGE_TIMESTAMP: 51aeb1a7
FAILURE_BUCKET_ID: X64_0x1a_41284_win32k!RFONTOBJ::vDeleteRFONT+32b
BUCKET_ID: X64_0x1a_41284_win32k!RFONTOBJ::vDeleteRFONT+32b
Followup: MachineOwner
---------
Minidump5: War des wo ich gestern schon geschickt hab.
Minidump6: Crash Dump Analysis provided by OSR Open Systems Resources, Inc. (
http://www.osr.com)
Online Crash Dump Analysis Service
See
http://www.osronline.com for more information
Windows 7 Kernel Version 7601 (Service Pack 1) MP (4 procs) Free x64
Product: WinNt, suite: TerminalServer SingleUserTS Personal
Built by: 7601.18229.amd64fre.win7sp1_gdr.130801-1533
Machine Name:
Kernel base = 0xfffff800`0324c000 PsLoadedModuleList = 0xfffff800`0348f6d0
Debug session time: Thu Sep 12 12:41:30.466 2013 (UTC - 4:00)
System Uptime: 0 days 5:02:09.449
*******************************************************************************
* *
* Bugcheck Analysis *
* *
*******************************************************************************
IRQL_NOT_LESS_OR_EQUAL (a)
An attempt was made to access a pageable (or completely invalid) address at an
interrupt request level (IRQL) that is too high. This is usually
caused by drivers using improper addresses.
If a kernel debugger is available get the stack backtrace.
Arguments:
Arg1: 0000000000000008, memory referenced
Arg2: 0000000000000002, IRQL
Arg3: 0000000000000001, bitfield :
bit 0 : value 0 = read operation, 1 = write operation
bit 3 : value 0 = not an execute operation, 1 = execute operation (only on chips which support this level of status)
Arg4: fffff800032cc512, address which referenced memory
Debugging Details:
------------------
TRIAGER: Could not open triage file : e:\dump_analysis\program\triage\modclass.ini, error 2
WRITE_ADDRESS: GetPointerFromAddress: unable to read from fffff800034f9100
GetUlongFromAddress: unable to read from fffff800034f91c0
0000000000000008 Nonpaged pool
CURRENT_IRQL: 2
FAULTING_IP:
nt!KiTimerExpiration+f2
fffff800`032cc512 48894808 mov qword ptr [rax+8],rcx
CUSTOMER_CRASH_COUNT: 1
DEFAULT_BUCKET_ID: WIN7_DRIVER_FAULT
BUGCHECK_STR: 0xA
PROCESS_NAME: System
TRAP_FRAME: fffff8800338d960 -- (.trap 0xfffff8800338d960)
NOTE: The trap frame does not contain all registers.
Some register values may be zeroed or incorrect.
rax=0000000000000000 rbx=0000000000000000 rcx=fffff88003368888
rdx=0000000000000098 rsi=0000000000000000 rdi=0000000000000000
rip=fffff800032cc512 rsp=fffff8800338daf0 rbp=000000000011bb98
r8=fffff88013368868 r9=00000000000000c1 r10=0000000000000098
r11=0000000000000000 r12=0000000000000000 r13=0000000000000000
r14=0000000000000000 r15=0000000000000000
iopl=0 nv up ei ng nz ac pe cy
nt!KiTimerExpiration+0xf2:
fffff800`032cc512 48894808 mov qword ptr [rax+8],rcx ds:00000000`00000008=????????????????
Resetting default scope
LAST_CONTROL_TRANSFER: from fffff800032c1129 to fffff800032c1b80
STACK_TEXT:
fffff880`0338d818 fffff800`032c1129 : 00000000`0000000a 00000000`00000008 00000000`00000002 00000000`00000001 : nt!KeBugCheckEx
fffff880`0338d820 fffff800`032bfda0 : 406fb24f`72e6e1a0 00000000`00000000 4149460d`00000000 0000002a`35fe86ae : nt!KiBugCheckDispatch+0x69
fffff880`0338d960 fffff800`032cc512 : 00000000`00018e53 00000000`0001da16 00000000`00000000 00000000`0001358e : nt!KiPageFault+0x260
fffff880`0338daf0 fffff800`032cc3c7 : 0000000d`fbb415c1 0000000d`0011bb98 0000000d`fbb41552 00000000`00000098 : nt!KiTimerExpiration+0xf2
fffff880`0338db90 fffff800`032b988a : fffff880`03365180 fffff880`0336ffc0 00000000`00000001 fffff800`00000000 : nt!KiRetireDpcList+0x277
fffff880`0338dc40 00000000`00000000 : fffff880`0338e000 fffff880`03388000 fffff880`0338dc00 00000000`00000000 : nt!KiIdleLoop+0x5a
STACK_COMMAND: kb
FOLLOWUP_IP:
nt!KiTimerExpiration+f2
fffff800`032cc512 48894808 mov qword ptr [rax+8],rcx
SYMBOL_STACK_INDEX: 3
SYMBOL_NAME: nt!KiTimerExpiration+f2
FOLLOWUP_NAME: MachineOwner
MODULE_NAME: nt
IMAGE_NAME: ntkrnlmp.exe
DEBUG_FLR_IMAGE_TIMESTAMP: 51fb06cd
FAILURE_BUCKET_ID: X64_0xA_nt!KiTimerExpiration+f2
BUCKET_ID: X64_0xA_nt!KiTimerExpiration+f2
Followup: MachineOwner
---------
CPU-Z:


Grafikkartentreiber ist AKTUELL
GRAKA UND CPU wurden NICHT übertaktet
DIRECT-X ist aktuell.