HP iPAQ H1915 im Test: PDA in klein und hübsch
5/5Sandra WinCE
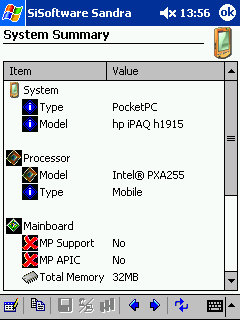
- SiSoft SandraCE ist ein synthetischer Benchmark. Er ist in der Lage, die wichtigsten Bestandteile des PCs auf ihre Geschwindigkeit hin zu überprüfen. Für unseren Prozessorvergleich sind jedoch drei Messungen besonders interessant:
- Sandra Prozessor-Test
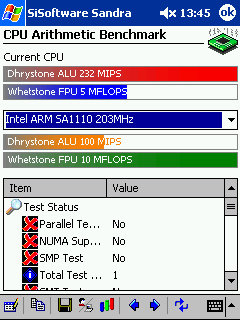
Hierbei kommt zum einen der Dhrystone Benchmark zum Einsatz, der ursprünglich von Siemens entwickelt wurde, um die Leistung des Hauptprozessors zu messen. Zum anderen wird über den Whetstone Benchmark die Leistung des Co-Prozessors bestimmt. Beide Tests erfolgen ohne die Berücksichtigung der erweiterten Multimedia-Befehlssätze. - Sandra Multimedia-Test
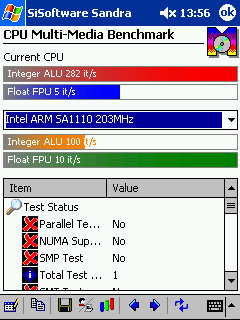
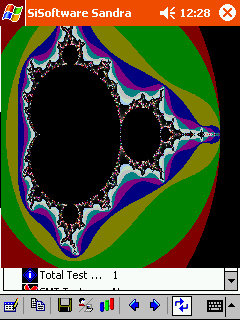
Beim Multimedia-Test von SandraCE wird ein Algorithmus eingesetzt, der unter anderem auch beim Generieren von realistischen Naturobjekten wie Bergen oder Wolken zum Einsatz kommt. Die Rede ist hier von der Chaostheorie - Stichwort Mandelbrot ('Apfelmännchen'). - Sandra Speicher-Test
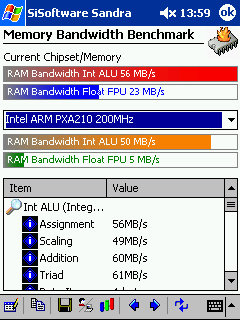
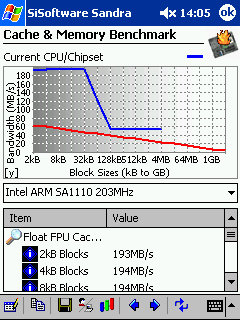
Der Memory-Benchmark bietet einen perfekten Überblick über das Zusammenspiel von CPU und Speicher.
- Sandra Prozessor-Test
- Weitere Informationen: SiSoftware.demon.co.uk
- Download: not avaible yet
| Axim X5 | MyPal A600 | iPAQ H1915 | |
|---|---|---|---|
| Processor | |||
| Model | Intel PXA250-XScale | Intel PXA250-XScale | Intel PXA250-XScale |
| Speed | 400MHz | 400MHz | 200MHz |
| Type | Mobile | Mobile | Mobile |
| Operating System(s) | |||
| Windows System | MS Windows CE 3.00.11171 |
MS Windows CE 3.00.11171 |
MS Windows CE 3.00.11171 |
| CPU Arithmetic Benchmark | |||
| Dhrystone ALU | 233 MIPS | 486 MIPS | 232 MIPS |
| Whetstone FPU | 11 MFLOPS | 11 MFLOPS | 5 MFLOPS |
| Number of Runs | 64000 / 640 | 64000 / 640 | 64000 / 640 |
| CPU Multi-Media Benchmark | |||
| Integer ALU | 563 it/s | 564 it/s | 282 it/s |
| Float FPU | 10 it/s | 10 it/s | 5 it/s |
| Rendered Image Size | 860x570 | 860x570 | 860x570 |
| Memory Bandwidth Benchmark | |||
| RAM Bandwith Int ALU | 71MB/s | 66MB/s | 56MB/s |
| RAM Bandwidth Float FPU | 35 MB/s | 34MB/s | 23MB/s |
| Memory Used by Test | 15MB | 15MB | 15MB |
| Int ALU (Integer STREAM) Results Breakdown | |||
| Assignment | 67MB/s | 63MB/s | 56MB/s |
| Scaling | 60MB/s | 56MB/s | 48MB/s |
| Addition | 79MB/s | 74MB/s | 61MB/s |
| Triad | 79MB/s | 75MB/s | 61MB/s |
| Data Item Size | 4-bytes | 4-bytes | 4-bytes |
| Buffering Used | No | No | No |
| Offset Displacement Used | Yes | Yes | Yes |
| Float FPU (Float STREAM) Results Breakdown | |||
| Assignmen | 61MB/s | 58MB/s | 49MB/s |
| Scaling | 26MB/s | 25MB/s | 15MB/s |
| Addition | 32MB/s | 32MB/s | 19MB/s |
| Triad | 21MB/s | 21MB/s | 12MB/s |
| Data Item Size | 8-bytes | 8-bytes | 8-bytes |
| Buffering Used | No | No | No |
| Offset Displacement Used | Yes | Yes | Yes |
| Cache & Memory Benchmark | |||
| Float FPU Cache/Memory Results Breakdown | |||
| 2kB Blocks | 387MB/s | 387MB/s | 193MB/s |
| 4kB Blocks | 389MB/s | 389MB/s | 194MB/s |
| 8kB Blocks | 390MB/s | 390MB/s | 194MB/s |
| 16kB Blocks | 390MB/s | 390MB/s | 194MB/s |
| 32kB Blocks | 388MB/s | 389MB/s | 194MB/s |
| 64kB Blocks | 219MB/s | 214MB/s | 123MB/s |
| 128kB Blocks | 70MB/ | 67MB/s | 57MB/s |
| 256kB Blocks | 69MB/s | 65MB/s | 55MB/s |
| 512kB Blocks | 69MB/s | 65MB/s | 55MB/s |
| 1MB Blocks | 70MB/s | 65MB/s | 55MB/s |
| 4MB Blocks | 69MB/s | 66MB/s | 56MB/s |
| Data Item Size | 4-bytes | 4-bytes | 4-bytes |
| Buffering Used | No | No | No |
| Offset Displacement Used | Yes | Yes | Yes |
| Internal Data Cache | 8kB Synchronous Write-Back | 8kB Synchronous Write-Back | 32kB Synchronous Write-Back |
Dieser Artikel war interessant, hilfreich oder beides? Die Redaktion freut sich über jede Unterstützung durch ComputerBase Pro und deaktivierte Werbeblocker. Mehr zum Thema Anzeigen auf ComputerBase.
CB-Funk Podcast #100: Neue Details zu RTX 50, RX 9000 und den CPUs der CES mit  Fabian und
  Jan-Frederik

