Du verwendest einen veralteten Browser. Es ist möglich, dass diese oder andere Websites nicht korrekt angezeigt werden. Du solltest ein Upgrade durchführen oder einen alternativen Browser verwenden.
Hallo liebe Leute, ich hoffe wirklich das man mir hier helfen kann, denn ich verweifle mittlerweile. Habe schon nach Lösungen gegoogelt, aber nix hat geholfen. Ich versuche es so kurz zu machen wie möglich^^:
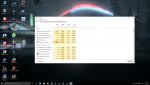
Ich hatte Jahrelang Windows 7 auf meinem selbstgebauten Rechner verwendet, ohne Probleme. Als dann Windows 10 verfügbar war, benutze ich dieses. Hatte bis dato auch keine Probleme. Allerdings waren meine Festplatten so voll mit Sachen(alte Games, Filme, Bilder etc) das ich mir dachte, alles runter werfen(deinstallieren) und alles neu drauf machen. Gesagt getan, Windows 10 neu installiert, ein paar Spiele via Steam, Origin und Uplay....Seitdem habe ich aber NUR Probleme. Wenn ich z.b. auf Steam was zocke, sei es Fallout 4, XCOM oder sonst was, fängt mein PC nach ca. 30-45min an voll zu laggen und ruckeln. Erst merkt man es am Sound, der stockt und hängt, dann die Spiele selbst, alles wird unspielbar. Allerdings habe ich das dann auch auf dem gesammten PC. Alles reagiert sehr träge, alles hängt. Habe schon die neuest Treiber drauf(WinZip Driver Updater sagt alle Treiber aktuell), Grafikkarten Treiber den neusten. Ich hatte sogar Windows neu installiert, aber das Problem besteht weiter hin. Per Anhänge kann man was sehen(sorry das es so klein ist). Wie gesagt, alle Treiber auf dem neusten Stand, sogar BIOS update gemacht, nix hilft. Und DPC Latency schlägt nach ca. 30-45min auch voll aus
Mein PC:
AMD FX 8120
ASUS Sabertooth 9990FX
16 GB DDR3 RAM
XFX R7970 Grafikkarte
XFX XXX Edition 650W Netzteil
ASUS VG278H Monitor
ASUS XONAR DX Soundkarte
SanDisk Ultra II 480GB SSD(Windows Laufwerk)
SanDisk Extreme 250 GB SSD
WD Caviar Black 2 TB
Läuft der Speicher vielleicht voll?
Das typische AMD Hitzeproblem sollte man bei deser CPU und Mainboard ausschließen können. Aber ALLE Frequenzen unter jeweiliger Last zu checken sollte man trotzdem wenn dies auftritt.
- G Data mal deaktivieren
- winzip driver updater (was ist denn das für nen Müll)
- Ccleaner wozu ?!
- Wozu hast du O&O Defrag laufen ?!
Je weniger unnütze Software läuft desto besser....
Vergiss diese ganzen "Optimierungstools". Du hast ein frisches Windows ! Da brauchst absolut nix an solcher Software, da wird gerne mehr kaputt gemacht...
Sorry, da läuft ne ganze Menge im Hintergrund die keiner braucht. von O&O Defrag bis "Analysis Proxy" (?)
Bestimmt min. ein Programm davon Malware. Driver Scann etc. ist auch Müll.- Alles Sachen die niemand braucht . Fehlt noch TuneUp,...
diese Sachen die ihr gerade aufführt, ich kann sie deaktivieren. aber sie sind nicht verantwortlich für die schlechte Latenz, denn ich habe sie erst vor 3Stunden installiert, das Problem besteht jedoch seit ein paar Tagen. Ich glaube das es aber durch das zocken ausgelöst wird! Denn immer wenn ich zocke laggt nach einer Zeit der Rechner! Wenn ich nur surfe oder so passiert das nicht.
Sorry, da läuft ne ganze Menge im Hintergrund die keiner braucht. von O&O Defrag bis "Analysis Proxy" (?)
Bestimmt min. ein Programm davon Malware. Driver Scann etc. ist auch Müll.- Alles Sachen die niemand braucht . Fehlt noch TuneUp,...
Der Proxy ist Teil von G-Data Security. AV Schlangenöl ist so ne Sache, aber ich behaupte mal der TE sieht es nicht als Malware an.
Zudem wäre dann der PC nicht erst nach 20-30 Minuten langsam, sondern sofort. Das sollte es also nicht sein.
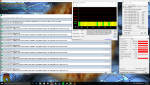
also, ich habe vor ca. 30-40 min angefangen XCOM: The Bureau zu zocken. Vorher war alles ok, nix am laggen, mitterlweile kann ich nicht mehr zocken(lagg), und siehe Anhang!
Ähm ja! Du sollstest beide Programme parallel oder erstmal jedes einzeln erstmal ein paar Minuten laufen lassen!Und dabei mit GPU-Z und Core temp deine CPU/GPU Temperaturen/Frequenzen beobachten!
ok.....Prime 95 läuft ja eh die ganze zeit durch, wenn ich es aktiviere. Aber wie schauts bei FurMark aus? Soll ich da den GPU Stress test anklicken, damit es permanent läuft?
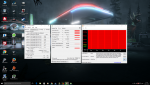
also meine lieben, habe nun eine stunde lang FurMark und Prime95 laufen lassen, im Anhang sieht man das "Ergebnis"......Was sagt mir das jetzt? Die Latenz Probleme treten wohl wirklich nur auf, wenn ich am zocken bin!
Mfg
David
Ergänzung ()
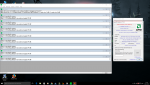
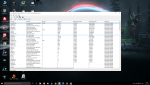
ein Kumpel von mir meinte ich solle auch mal LatencyMon laufen lassen.....im Anhang die "Auswertung" wenn ich nicht zocke
Ergänzung ()
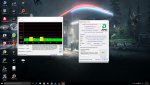
so, und nun wenn ich wieder am zocken bin, sagt mir latencymon das:
CONCLUSION
_________________________________________________________________________________________________________
Your system appears to be having trouble handling real-time audio and other tasks. You are likely to experience buffer underruns appearing as drop outs, clicks or pops. One or more DPC routines that belong to a driver running in your system appear to be executing for too long. One problem may be related to power management, disable CPU throttling settings in Control Panel and BIOS setup. Check for BIOS updates.
LatencyMon has been analyzing your system for 0:12:40 (h:mm:ss) on all processors.
_________________________________________________________________________________________________________
SYSTEM INFORMATION
_________________________________________________________________________________________________________
Computer name: AVENTURIEN
OS version: Windows 8 , 6.2, build: 9200 (x64)
Hardware: ASUSTeK COMPUTER INC., SABERTOOTH 990FX
CPU: AuthenticAMD AMD FX(tm)-8120 Eight-Core Processor
Logical processors: 8
Processor groups: 1
RAM: 16329 MB total
_________________________________________________________________________________________________________
CPU SPEED
_________________________________________________________________________________________________________
Reported CPU speed: 3110 MHz
Measured CPU speed: 1 MHz (approx.)
Note: reported execution times may be calculated based on a fixed reported CPU speed. Disable variable speed settings like Intel Speed Step and AMD Cool N Quiet in the BIOS setup for more accurate results.
WARNING: the CPU speed that was measured is only a fraction of the CPU speed reported. Your CPUs may be throttled back due to variable speed settings and thermal issues. It is suggested that you run a utility which reports your actual CPU frequency and temperature.
_________________________________________________________________________________________________________
MEASURED INTERRUPT TO USER PROCESS LATENCIES
_________________________________________________________________________________________________________
The interrupt to process latency reflects the measured interval that a usermode process needed to respond to a hardware request from the moment the interrupt service routine started execution. This includes the scheduling and execution of a DPC routine, the signaling of an event and the waking up of a usermode thread from an idle wait state in response to that event.
Highest measured interrupt to process latency (µs): 5602,667378
Average measured interrupt to process latency (µs): 31,254817
Highest measured interrupt to DPC latency (µs): 4779,937115
Average measured interrupt to DPC latency (µs): 24,774351
_________________________________________________________________________________________________________
REPORTED ISRs
_________________________________________________________________________________________________________
Interrupt service routines are routines installed by the OS and device drivers that execute in response to a hardware interrupt signal.
Highest ISR routine execution time (µs): 61,078778
Driver with highest ISR routine execution time: storport.sys - Microsoft Storage Port Driver, Microsoft Corporation
Highest reported total ISR routine time (%): 0,012424
Driver with highest ISR total time: Wdf01000.sys - Kernelmodustreiber-Frameworklaufzeit, Microsoft Corporation
Total time spent in ISRs (%) 0,016840
ISR count (execution time <250 µs): 366030
ISR count (execution time 250-500 µs): 0
ISR count (execution time 500-999 µs): 0
ISR count (execution time 1000-1999 µs): 0
ISR count (execution time 2000-3999 µs): 0
ISR count (execution time >=4000 µs): 0
_________________________________________________________________________________________________________
REPORTED DPCs
_________________________________________________________________________________________________________
DPC routines are part of the interrupt servicing dispatch mechanism and disable the possibility for a process to utilize the CPU while it is interrupted until the DPC has finished execution.
Highest DPC routine execution time (µs): 4972,762701
Driver with highest DPC routine execution time: Wdf01000.sys - Kernelmodustreiber-Frameworklaufzeit, Microsoft Corporation
Highest reported total DPC routine time (%): 2,671705
Driver with highest DPC total execution time: Wdf01000.sys - Kernelmodustreiber-Frameworklaufzeit, Microsoft Corporation
Total time spent in DPCs (%) 4,694997
DPC count (execution time <250 µs): 3927186
DPC count (execution time 250-500 µs): 0
DPC count (execution time 500-999 µs): 166861
DPC count (execution time 1000-1999 µs): 42262
DPC count (execution time 2000-3999 µs): 35026
DPC count (execution time >=4000 µs): 0
_________________________________________________________________________________________________________
REPORTED HARD PAGEFAULTS
_________________________________________________________________________________________________________
Hard pagefaults are events that get triggered by making use of virtual memory that is not resident in RAM but backed by a memory mapped file on disk. The process of resolving the hard pagefault requires reading in the memory from disk while the process is interrupted and blocked from execution.
Process with highest pagefault count: gdscan.exe
Total number of hard pagefaults 424
Hard pagefault count of hardest hit process: 321
Highest hard pagefault resolution time (µs): 441,205788
Total time spent in hard pagefaults (%): 0,000162
Number of processes hit: 9
_________________________________________________________________________________________________________
PER CPU DATA
_________________________________________________________________________________________________________
CPU 0 Interrupt cycle time (s): 298,598818
CPU 0 ISR highest execution time (µs): 52,299357
CPU 0 ISR total execution time (s): 0,467007
CPU 0 ISR count: 178124
CPU 0 DPC highest execution time (µs): 4972,762701
CPU 0 DPC total execution time (s): 270,801325
CPU 0 DPC count: 3221104
_________________________________________________________________________________________________________
CPU 1 Interrupt cycle time (s): 24,529369
CPU 1 ISR highest execution time (µs): 48,644695
CPU 1 ISR total execution time (s): 0,114124
CPU 1 ISR count: 21888
CPU 1 DPC highest execution time (µs): 2423,068167
CPU 1 DPC total execution time (s): 9,730017
CPU 1 DPC count: 480371
_________________________________________________________________________________________________________
CPU 2 Interrupt cycle time (s): 9,777521
CPU 2 ISR highest execution time (µs): 61,078778
CPU 2 ISR total execution time (s): 0,210597
CPU 2 ISR count: 29353
CPU 2 DPC highest execution time (µs): 195,443087
CPU 2 DPC total execution time (s): 0,596388
CPU 2 DPC count: 72125
_________________________________________________________________________________________________________
CPU 3 Interrupt cycle time (s): 9,605107
CPU 3 ISR highest execution time (µs): 27,062379
CPU 3 ISR total execution time (s): 0,027014
CPU 3 ISR count: 13708
CPU 3 DPC highest execution time (µs): 195,408039
CPU 3 DPC total execution time (s): 0,557092
CPU 3 DPC count: 70396
_________________________________________________________________________________________________________
CPU 4 Interrupt cycle time (s): 11,448873
CPU 4 ISR highest execution time (µs): 28,196463
CPU 4 ISR total execution time (s): 0,027916
CPU 4 ISR count: 13349
CPU 4 DPC highest execution time (µs): 194,276849
CPU 4 DPC total execution time (s): 0,672597
CPU 4 DPC count: 74217
_________________________________________________________________________________________________________
CPU 5 Interrupt cycle time (s): 10,760124
CPU 5 ISR highest execution time (µs): 28,413505
CPU 5 ISR total execution time (s): 0,026685
CPU 5 ISR count: 13524
CPU 5 DPC highest execution time (µs): 194,386817
CPU 5 DPC total execution time (s): 0,585705
CPU 5 DPC count: 71219
_________________________________________________________________________________________________________
CPU 6 Interrupt cycle time (s): 11,316904
CPU 6 ISR highest execution time (µs): 32,772990
CPU 6 ISR total execution time (s): 0,030933
CPU 6 ISR count: 16101
CPU 6 DPC highest execution time (µs): 192,363987
CPU 6 DPC total execution time (s): 1,334846
CPU 6 DPC count: 92976
_________________________________________________________________________________________________________
CPU 7 Interrupt cycle time (s): 11,402211
CPU 7 ISR highest execution time (µs): 33,775884
CPU 7 ISR total execution time (s): 0,119685
CPU 7 ISR count: 79983
CPU 7 DPC highest execution time (µs): 192,099035
CPU 7 DPC total execution time (s): 1,207164
CPU 7 DPC count: 89116
_________________________________________________________________________________________________________
Ergänzung ()
Ich glaube der "Übeltäter" ist wohl der Kernelmodustreiber Wdf01000.sys...Nur falls dem so ist, was kann ich tun? Habe bei google kein Antwort darauf gefunden