Hallo,
ich habe mir einen neuen PC zusammengestellt, leider fabriziert dieser nun immer wieder Bluescreens. Mal beim surfen im Internet mit Chrome, mal bei iTunes oder auch bei Starcraft II. Ein wirkliches System hinter den Bluescreens hab ich bisher nicht entdecken können.
Zum PC:
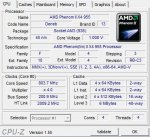
AMD Phenom II x4 955
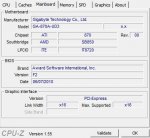
Gigabyte 870a-UD3
Gigabyte GTX460 OC 1024MB
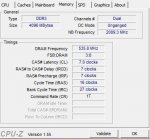
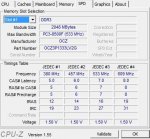
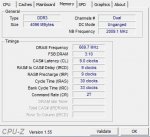
2x2GB OCZ Platinum DDR3 CL7 1333 Kit
Enermax Pro82+ 425w
Samsung SpinPoint F3 500GB
Windows 7 Home Premium 64bit
Die Bluescreens die ich bisher gesehen habe waren: "memory_management" und "pfn_list_corrupt" und ich meine es wäre noch ein dritter vorgekommen.
Wie hier beschrieben https://www.computerbase.de/forum/threads/bluescreen.715519/#post-7575054 habe ich die Minidump auswerten lassen.
Der letzte Bluescreen war ein "pfn_list_corrupt".
Ich hoffe das hilft und ihr könnt mir damit helfen.
Dankeschön schon mal im vorraus.
Aleksej
ich habe mir einen neuen PC zusammengestellt, leider fabriziert dieser nun immer wieder Bluescreens. Mal beim surfen im Internet mit Chrome, mal bei iTunes oder auch bei Starcraft II. Ein wirkliches System hinter den Bluescreens hab ich bisher nicht entdecken können.
Zum PC:
AMD Phenom II x4 955
Gigabyte 870a-UD3
Gigabyte GTX460 OC 1024MB
2x2GB OCZ Platinum DDR3 CL7 1333 Kit
Enermax Pro82+ 425w
Samsung SpinPoint F3 500GB
Windows 7 Home Premium 64bit
Die Bluescreens die ich bisher gesehen habe waren: "memory_management" und "pfn_list_corrupt" und ich meine es wäre noch ein dritter vorgekommen.
Wie hier beschrieben https://www.computerbase.de/forum/threads/bluescreen.715519/#post-7575054 habe ich die Minidump auswerten lassen.
Der letzte Bluescreen war ein "pfn_list_corrupt".
Microsoft (R) Windows Debugger Version 6.12.0002.633 AMD64
Copyright (c) Microsoft Corporation. All rights reserved.
Loading Dump File [C:\Windows\MEMORY.DMP]
Kernel Summary Dump File: Only kernel address space is available
Symbol search path is: SRV*C:\symbols*http://msdl.microsoft.com/download/symbols
Executable search path is:
Windows 7 Kernel Version 7600 MP (4 procs) Free x64
Product: WinNt, suite: TerminalServer SingleUserTS Personal
Built by: 7600.16617.amd64fre.win7_gdr.100618-1621
Machine Name:
Kernel base = 0xfffff800`0380f000 PsLoadedModuleList = 0xfffff800`03a4ce50
Debug session time: Tue Sep 14 22:49:36.723 2010 (UTC + 2:00)
System Uptime: 0 days 3:23:19.128
Loading Kernel Symbols
...............................................................
................................................................
..................
Loading User Symbols
PEB is paged out (Peb.Ldr = 00000000`fffdf018). Type ".hh dbgerr001" for details
Loading unloaded module list
......
*******************************************************************************
* *
* Bugcheck Analysis *
* *
*******************************************************************************
Use !analyze -v to get detailed debugging information.
BugCheck 4E, {99, 12a151, 2, 12a150}
Probably caused by : memory_corruption ( nt!MiBadShareCount+4c )
Followup: MachineOwner
---------
3: kd> !analyze –v
*******************************************************************************
* *
* Bugcheck Analysis *
* *
*******************************************************************************
Use !analyze -v to get detailed debugging information.
BugCheck 4E, {99, 12a151, 2, 12a150}
Probably caused by : memory_corruption ( nt!MiBadShareCount+4c )
Followup: MachineOwner
---------
3: kd> !analyze -v
*******************************************************************************
* *
* Bugcheck Analysis *
* *
*******************************************************************************
PFN_LIST_CORRUPT (4e)
Typically caused by drivers passing bad memory descriptor lists (ie: calling
MmUnlockPages twice with the same list, etc). If a kernel debugger is
available get the stack trace.
Arguments:
Arg1: 0000000000000099, A PTE or PFN is corrupt
Arg2: 000000000012a151, page frame number
Arg3: 0000000000000002, current page state
Arg4: 000000000012a150, 0
Debugging Details:
------------------
BUGCHECK_STR: 0x4E_99
DEFAULT_BUCKET_ID: VISTA_DRIVER_FAULT
PROCESS_NAME: mscorsvw.exe
CURRENT_IRQL: 2
LAST_CONTROL_TRANSFER: from fffff8000390f38c to fffff8000387f740
STACK_TEXT:
fffff880`06d25108 fffff800`0390f38c : 00000000`0000004e 00000000`00000099 00000000`0012a151 00000000`00000002 : nt!KeBugCheckEx
fffff880`06d25110 fffff800`038f19e5 : 00000000`00000000 fffff680`0002f8d8 3af00000`3ef52025 00000000`00000001 : nt!MiBadShareCount+0x4c
fffff880`06d25150 fffff800`03853c23 : fffffa80`05260950 fffff700`00000d56 0000007f`fffffff8 fffff8a0`097d8068 : nt! ?? ::FNODOBFM::`string'+0x3222c
fffff880`06d251e0 fffff800`0385268a : fffffa80`05260950 fffffa80`00000006 fffff8a0`000002f3 00000000`00000000 : nt!MiDeleteAddressesInWorkingSet+0x307
fffff880`06d25a90 fffff800`03b64dcf : fffff8a0`0bec3a70 00000000`00000001 00000000`00000000 fffffa80`066d0b60 : nt!MmCleanProcessAddressSpace+0x96
fffff880`06d25ae0 fffff800`03b3c85b : 00000000`00000000 00000000`00000001 00000000`fffdb000 00000000`00000000 : nt!PspExitThread+0x92f
fffff880`06d25ba0 fffff800`0387e993 : fffffa80`05260950 00000000`00000000 00000000`fffdb001 fffffa80`066d0b60 : nt!NtTerminateProcess+0x25b
fffff880`06d25c20 00000000`76df017a : 00000000`00000000 00000000`00000000 00000000`00000000 00000000`00000000 : nt!KiSystemServiceCopyEnd+0x13
00000000`0025dd38 00000000`00000000 : 00000000`00000000 00000000`00000000 00000000`00000000 00000000`00000000 : 0x76df017a
STACK_COMMAND: kb
FOLLOWUP_IP:
nt!MiBadShareCount+4c
fffff800`0390f38c cc int 3
SYMBOL_STACK_INDEX: 1
SYMBOL_NAME: nt!MiBadShareCount+4c
FOLLOWUP_NAME: MachineOwner
MODULE_NAME: nt
DEBUG_FLR_IMAGE_TIMESTAMP: 4c1c44a9
IMAGE_NAME: memory_corruption
FAILURE_BUCKET_ID: X64_0x4E_99_nt!MiBadShareCount+4c
BUCKET_ID: X64_0x4E_99_nt!MiBadShareCount+4c
Followup: MachineOwner
---------
Ich hoffe das hilft und ihr könnt mir damit helfen.
Dankeschön schon mal im vorraus.
Aleksej